January 14, 2026
Earth observation satellites provide near-real-time information for detecting and monitoring wildfires, supporting informed decision-making during fire events and assessing post-fire impacts. SANSA leverages satellite data with low to high spatial and temporal resolution to support all phases of the fire disaster management cycle.
SANSA leverages open-access and commercial satellite imagery to support wildfire detection and monitoring, as well as the assessment of fire origins and associated damages.
See below satellite images over two selected areas that have been affected by wildfires in Western Cape and Eastern Cape Provinces since last week:
Franschoek
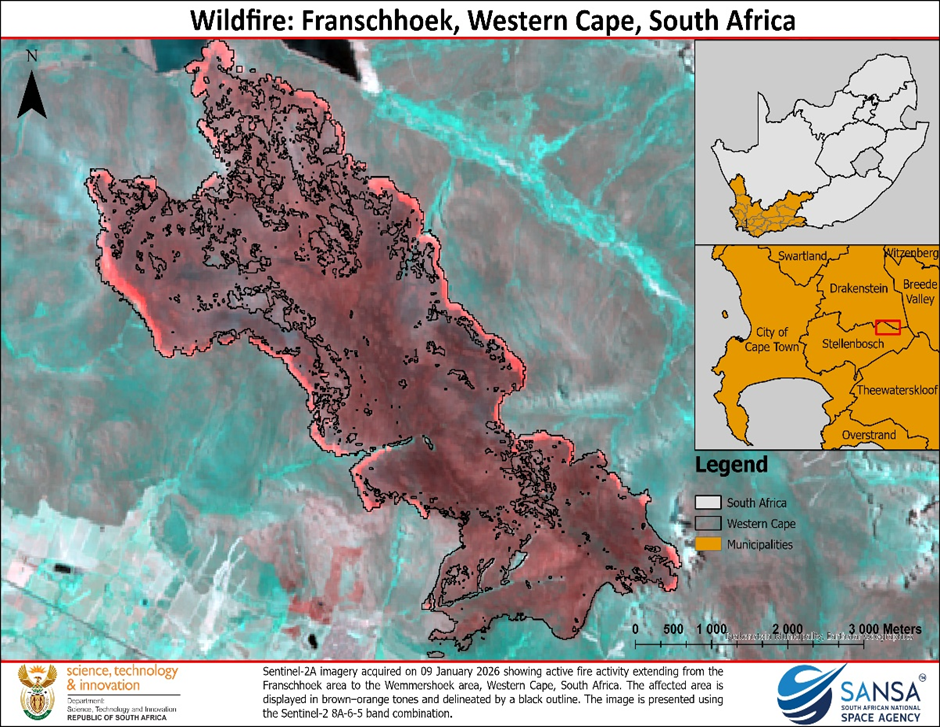
The false colour image on the map shows active fires and fire-burnt scar around Franshoek and Wemmershoek Forest Reserve areas as captured by Sentinel 2A satellite on 09 January 2026. The area affected is displayed in brown-orange tons and delineated by a black outline. The image is presented using Sentinel 2 8A-6-5 band combination.
Garden Route:
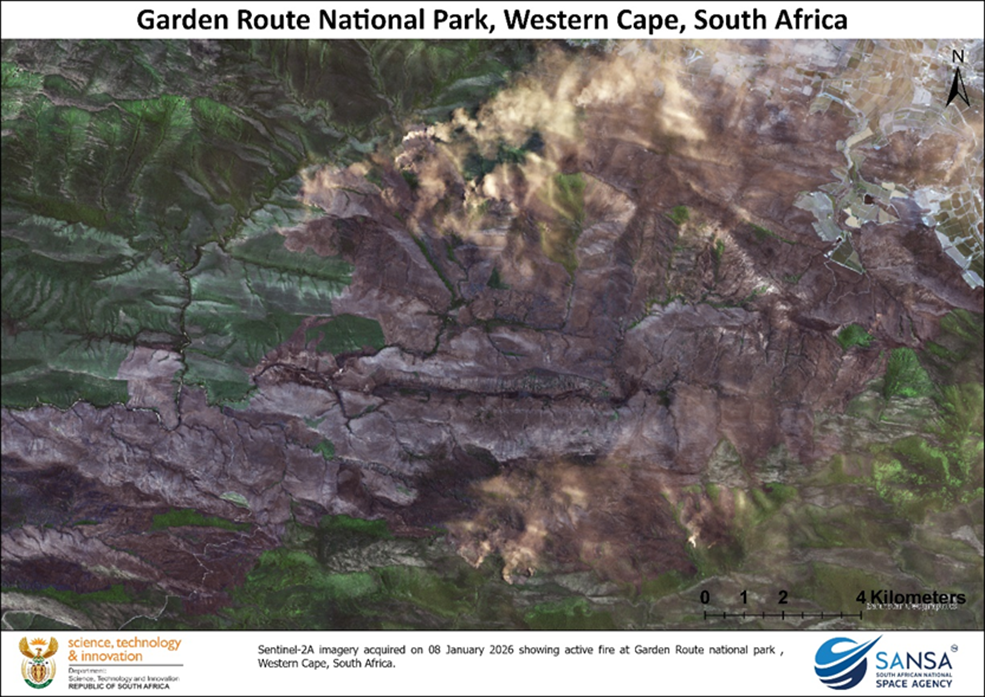
The natural colour image on the map shows active fires and fire-burnt scar around Garden Route National Park acquired by Sentinel 2A satellite on 08 January 2026. Smoke can be observed around the areas that were burning during the time of acquisition.
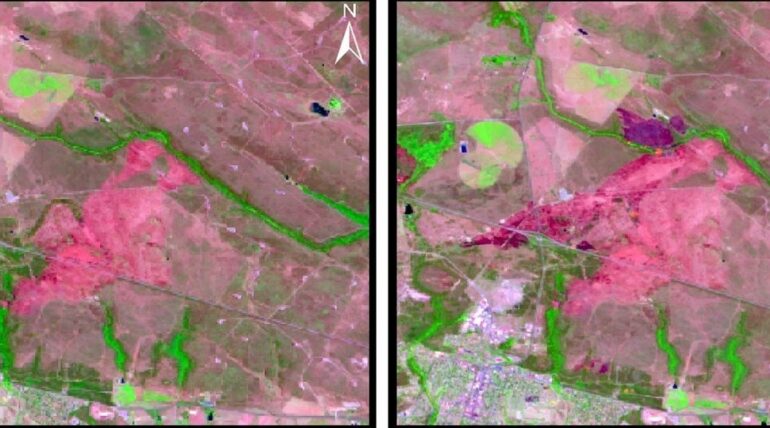
Humansdorp:
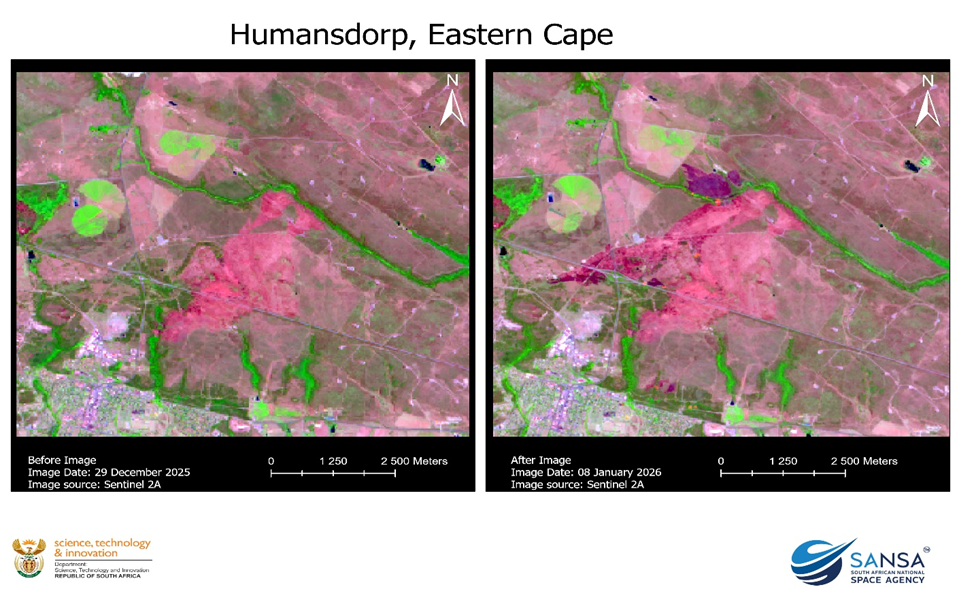
The false colour image on the map shows an old and new fire-burnt scar around Humansdorp, Eastern Cape, Reserve areas as captured by Sentinel 2 satellite on 08 January 2026. The areas affect by fire in January 2026 located in the red circle. The image is presented using Sentinel 2 12-8-4 band combination.
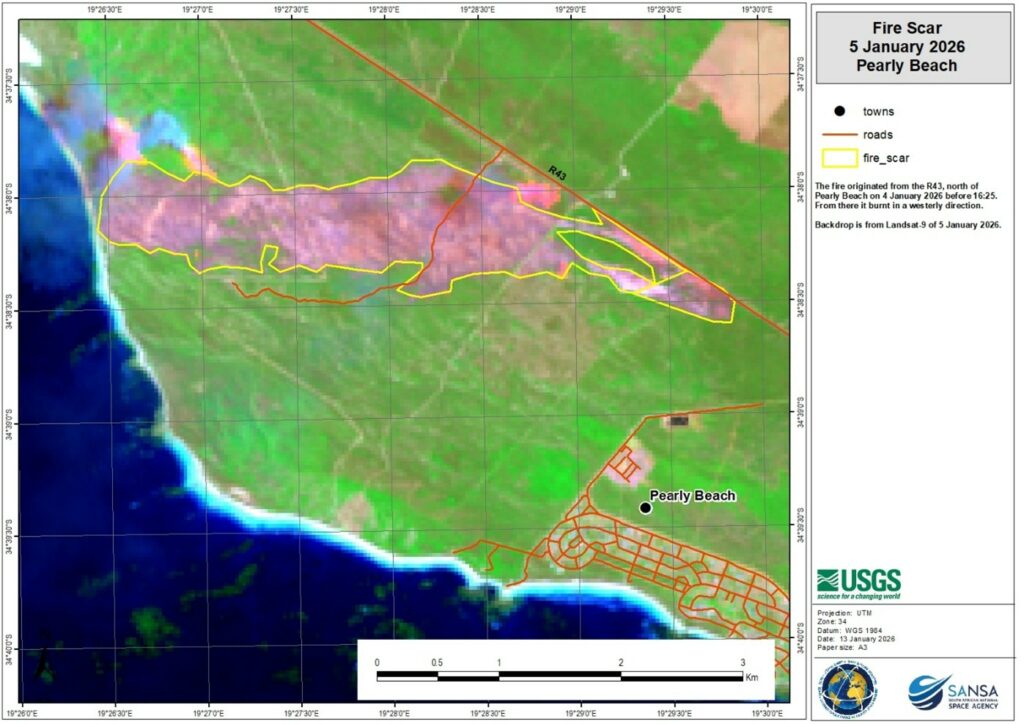
Pearly Beach:
The mapped burn scar from Pearly Beach reveals a continuous and elongated fire footprint extending parallel to the coastline, with the highest burn intensity concentrated in the central and eastern portions of the affected area. The spatial pattern suggests wind-driven fire spread, with the scar widening in areas of continuous natural vegetation and narrowing near infrastructure corridors. Although the fire perimeter approached the outskirts of Pearly Beach, the burned area largely remained outside the urban footprint, indicating limited direct impact on residential zones. The burn scar geometry and alignment are consistent with regional topography and prevailing coastal wind conditions during the January 2026 fire event.
The Pearly Beach wildfire produced an extensive and largely continuous burn scar spanning coastal and inland landscapes. The most severely affected areas are concentrated within the central portion of the fire footprint, where strong reductions in vegetation cover are evident. More heterogeneous burn patterns are observed toward the edges of the scar, suggesting variability in fire intensity and fuel availability. The proximity of the burn scar to the coastline and nearby settlements underscores the vulnerability of coastal environments to wildfire events.
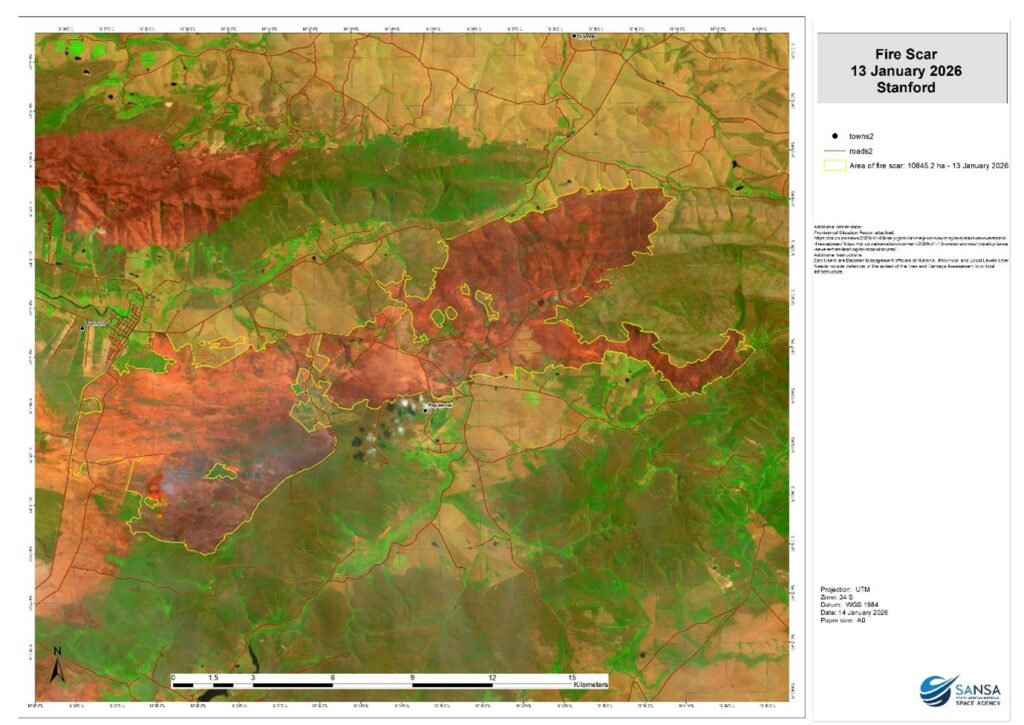
Stanford:
The Stanford fire scar displays a large, continuous burned area with pronounced spatial heterogeneity. High burn impact zones are concentrated in the central and western sections of the scar, while lower-intensity or patchier burn patterns are observed toward the periphery. The fire affected both natural vegetation and cultivated lands, reflecting fuel continuity across land-use types. The burn perimeter intersects multiple transport corridors, indicating potential disruption to infrastructure during the fire event. Overall, the spatial extent and configuration of the scar suggest rapid fire propagation under favourable burning conditions on 13 January 2026.
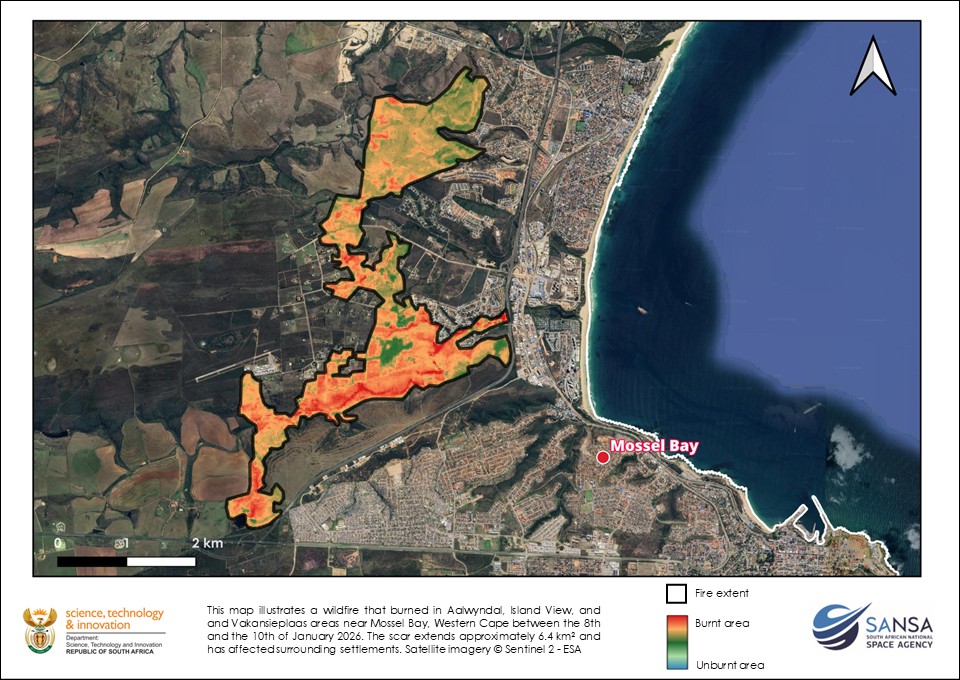
Mossel Bay
The map below shows the extent and severity of a wildfire near Mossel Bay along the southern coast of South Africa. Burnt areas are highlighted in red to orange, unburnt areas in green, overlaid on satellite imagery. The fire affected parts of Asandrif, Island View, and Vleesbaai during January 2026, with the mapped burn scar covering roughly 6.4 km². Nearby urban areas and infrastructure are visible, showing how close the fire came to settlements. The data is derived from Sentinel-2 satellite imagery and presented by SANSA.
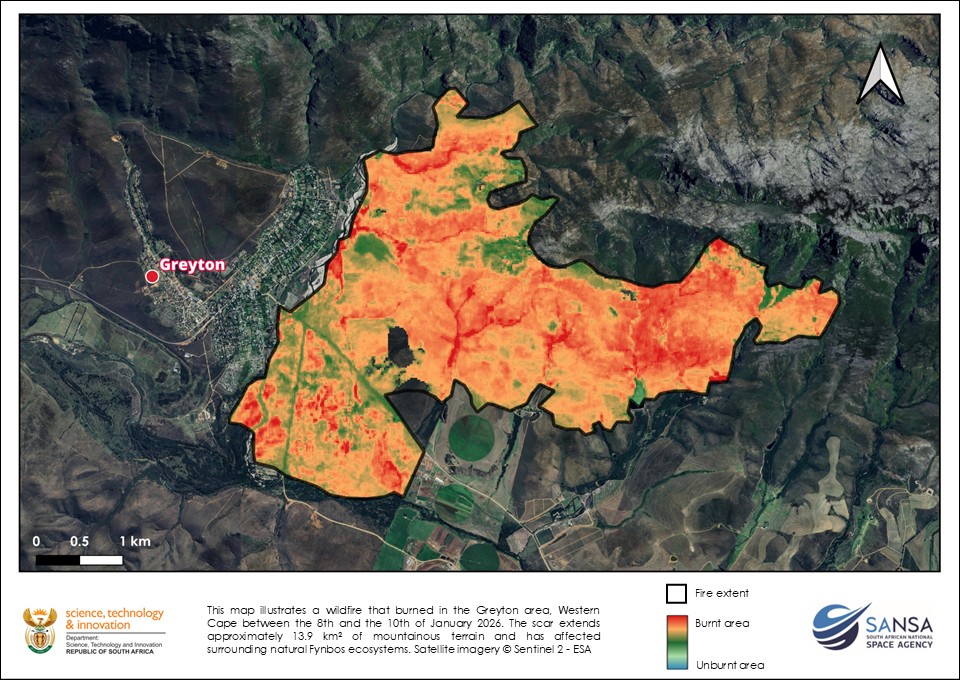
Greyton:
This map depicts the burn scar associated with the wildfire that occurred near Greytown in the Western Cape on 10 January 2026. The fire extent is delineated by the outlined boundary, within which burned and unburned areas are distinguished using satellite-derived information.
Burned areas are shown in red to orange tones, indicating varying degrees of vegetation loss and surface disturbance caused by the fire. Areas displayed in green represent vegetation that remained unburned or experienced limited fire impact. The spatial pattern of the burn scar reveals a largely continuous fire footprint across mountainous terrain, with pockets of unburned vegetation persisting along drainage lines, agricultural boundaries, and areas of lower fuel continuity.
The fire scar covers an estimated 138 km², affecting predominantly natural fynbos ecosystems and adjacent land-use areas. The proximity of the burned area to the town of Greytown highlights the interface between natural vegetation and human settlements, underscoring the potential risks posed by wildfires in the wildland–urban interface.
The burn scar was mapped using Sentinel-2 satellite imagery, which enables clear discrimination between burned and unburned surfaces based on post-fire spectral responses. This satellite-based assessment supports rapid damage evaluation, environmental impact assessment, and post-fire rehabilitation planning.
Soetkraal / Keurbooms:
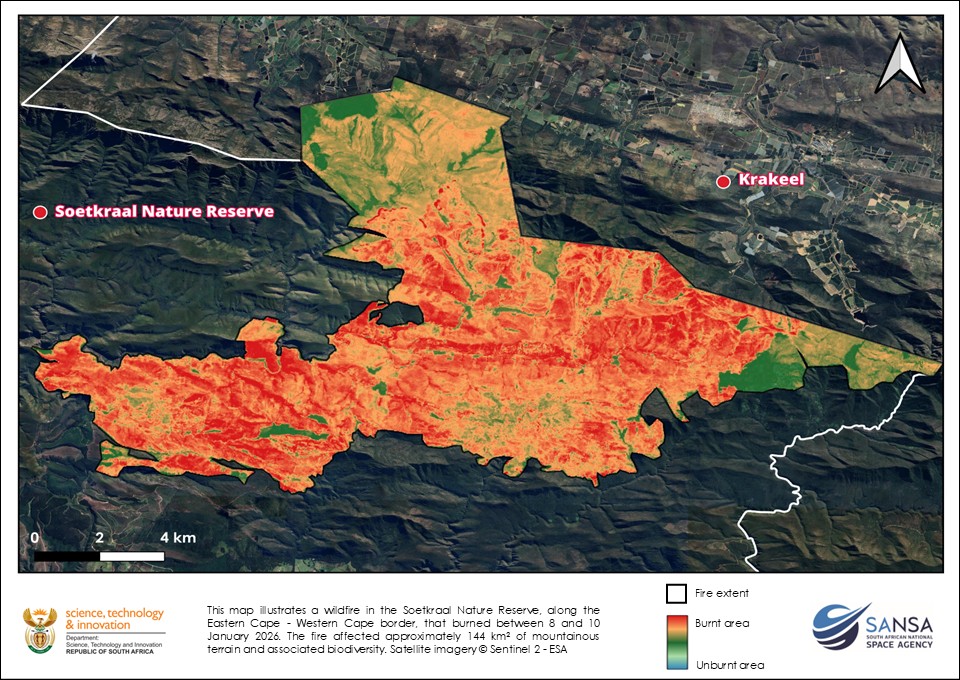
This map below illustrates the burn scar and burn severity pattern associated with the wildfire that occurred in the Soetkraal Nature Reserve in the Eastern Cape, South Africa, between 8 and 10 January 2026. The fire extent is delineated by the outlined boundary, within which burned and unburned areas are mapped using satellite imagery.
Burned areas are shown in red to orange tones, indicating extensive vegetation loss caused by the fire, while green areas represent vegetation that remained unburned or was minimally affected. The spatial distribution of the burn scar highlights a largely continuous fire footprint across mountainous terrain, with limited unburned patches occurring primarily along drainage lines and topographic breaks, suggesting localized variations in fire intensity and fuel conditions.
The proximity of the burn scar to key landmarks, including the Soetkraal Nature Reserve and nearby settlements such as Krakeel, emphasizes the ecological and socio-environmental significance of the event. The mapped fire footprint covers approximately 144 km², indicating a large-scale disturbance with potential implications for biodiversity, soil stability, and post-fire erosion processes.
The burn scar was derived from Sentinel-2 satellite imagery acquired shortly after the event, enabling clear differentiation between burned and unburned surfaces based on their spectral response. This satellite-based assessment provides an objective and spatially consistent representation of fire impacts, supporting post-fire damage assessment, rehabilitation planning, and environmental monitoring.
SANSA’s Earth Observation division continues to analyse the wildfires to assist government and private sector with insights to manage the fires and to support post-fire recovery efforts. To access detailed report, maps or data over other areas, please contact Customer Services at
customers-eo@sansa.org.za