IOCAP
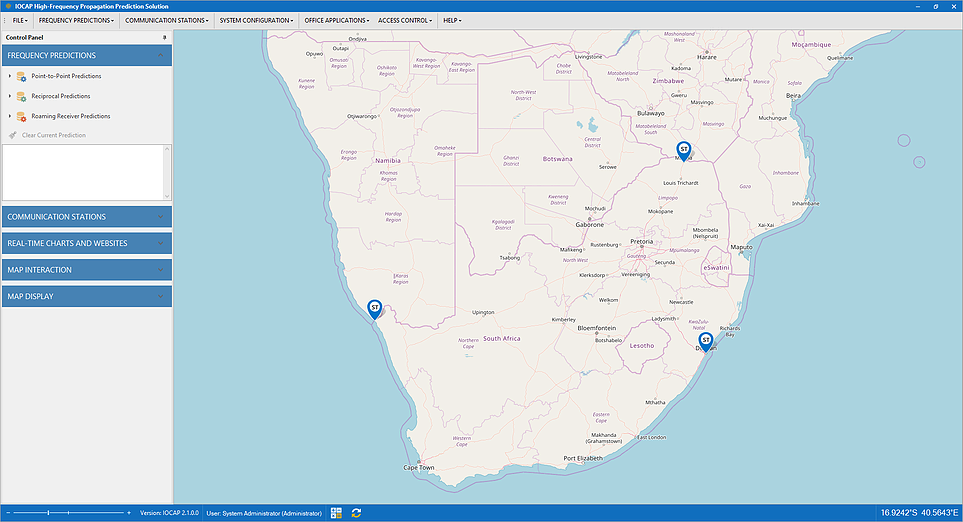
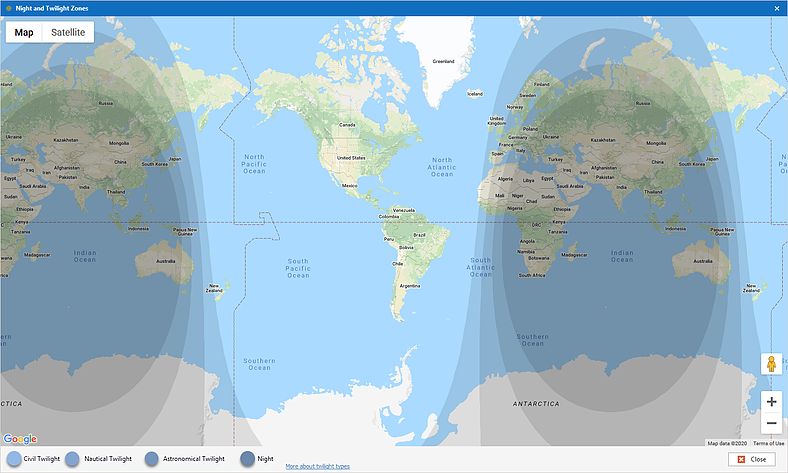
 IOCAP features two sets of world-wide maps, both of which are able to download new information from the internet as you zoom and scroll.
Maps can be annotated with communication stations and location markers, and distances measured by simply clicking two points.
Maps and their annotations can be printed and exported individually.
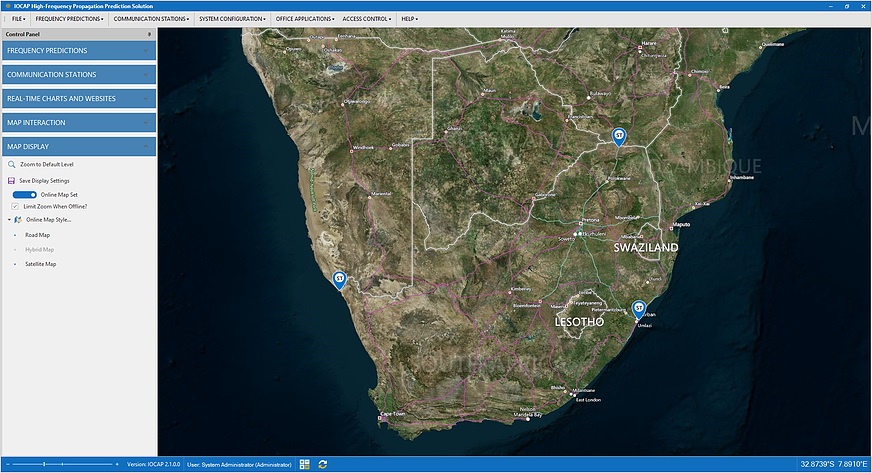
When an internet connection is detected, an online map service automatically becomes available for selection. This option features an alternate road map to the standard set, which includes the ability to select an annotated satellite, capable of zooming to street level.
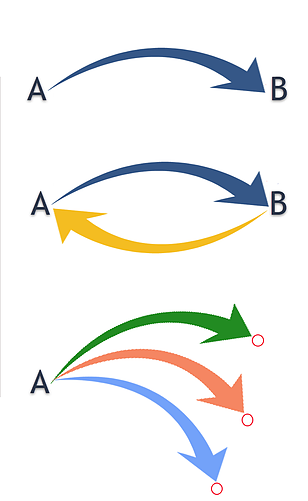
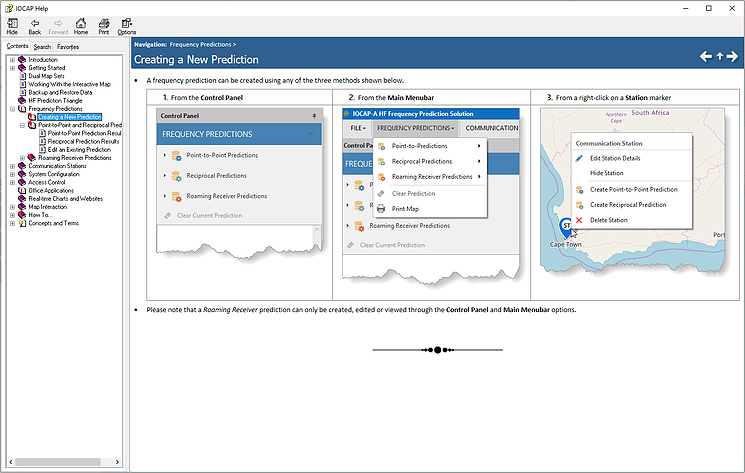
- Point to Point Prediction.
In this scheme it is assumed that both stations in the circuit have similar transmitters, receivers and antennas, so that the prediction from A to B is also valid for the return circuit from B to A.
- Reciprocal Prediction.
In this instance the assumption is that the two station are asymmetric in design and characteristics, so two predictions are produced: one from A to B, using the transmitter at A and the receiver at B; and another from B to A, now using the transmitter at B and the receiver at A. This is not the same as simply reversing the direction of the circuit. The two predictions are then displayed side by side for easy comparison.
- Roaming Receiver Prediction.
This solution assumes a stationary base station and a constantly moving receiver, such as a vehicle or ship. A point to point or reciprocal prediction is then created between the base station and each way point. The results are neatly packaged in a single, easy to understand report.
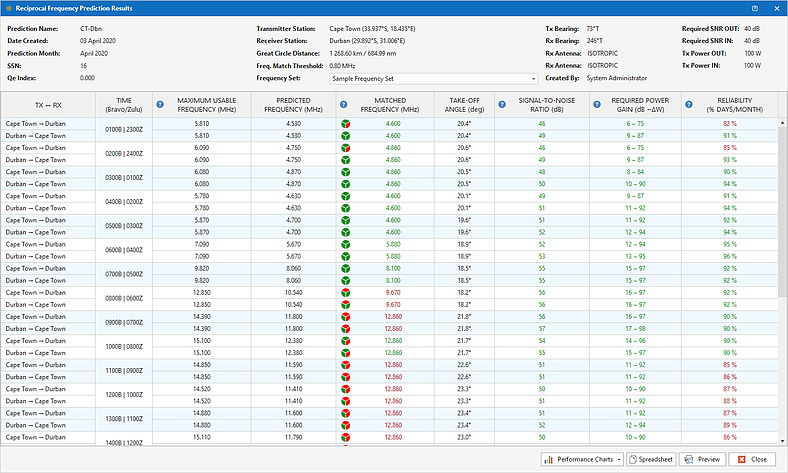
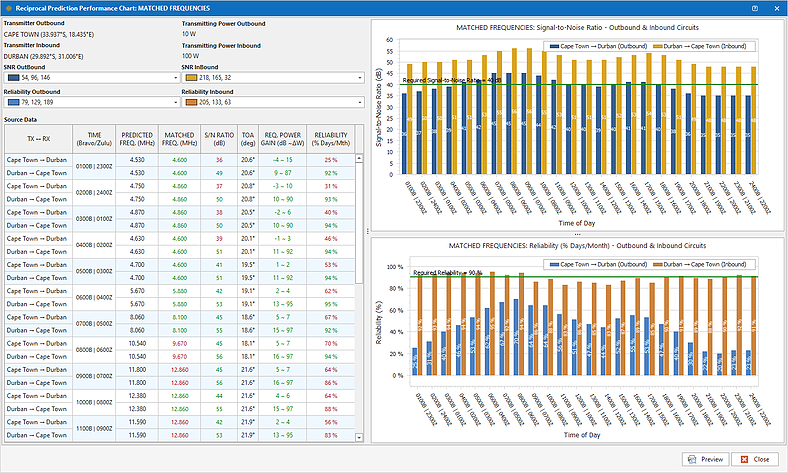
Prediction results are shown in tabular format with colour-coded columns. If any value exceeds a preset threshold, it shows up red. If it does not exceed the threshold it will show up green. This allows the user to assess at a glance the quality of service that can be expected from the prediction.
Since HF bandwidth practices only allow users certain frequencies, the predicted frequencies to ensure effective communication can rarely be used as given. Unlike other prediction tools, when IOCAP runs a prediction, it seeks in the provided list of available frequencies the closest match to the predicted frequencies and displays this in a dedicated column.
There are several performance charts to choose from, each providing a slightly different perspective on the predicted frequency set.
In the chart shown here, the performance of the ‘matched’, or available, frequencies, is shown for a reciprocal prediction. It now becomes a simple exercise to compare signal-to-noise ratios and circuit reliability on both outbound and inbound circuits by comparing which bars meet the target value (shown as a green horizontal bar), and which ones fall short.
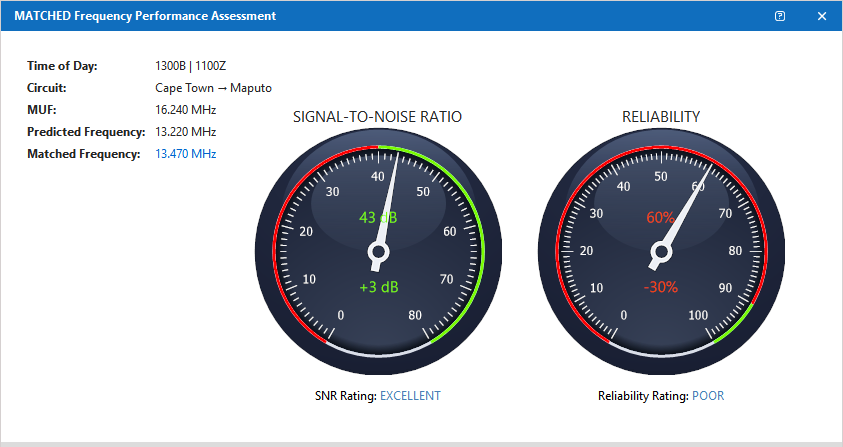 The three elements of a frequency prediction considered to be the most critical are:
- The variance between the predicted and matched frequency.
- The signal-to-noise ratio.
- The circuit reliability.
These critical metrics are shown in a tri-colour composition to provide an instantaneous assessment of the predicted service quality of both the predicted and the matched frequencies. In addition, a qualitative text rating of each parameter is provided.
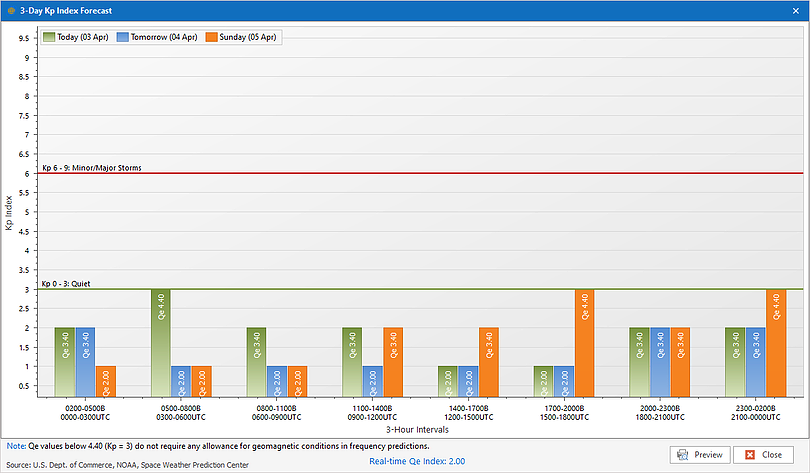
IOCAP does not require an internet connection to perform any of its functions. However, when such a connection is detected, a range of additional functions automatically becomes available.
For example, a real-time three-day forecast of geomagnetic activity (Kp index) is obtained from NOAA (USA) and displayed in an intuitive chart (shown). This allows IOCAP users to influence its frequency predictions with prevailing, real-time geomagnetic conditions.
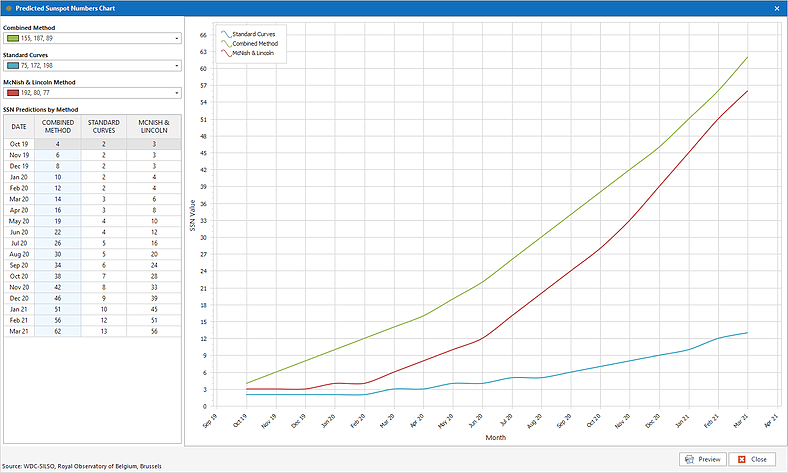
The smoothed sunspot number (SSN) database is automatically synced with the latest data from the Royal Observatory of Belgium to ensure that predictions always use the most up-to-date SSN values.
IOCAP contains a comprehensive embedded Help system. All procedures and terms are explained in great detail. Most pages have a Help link which provides context-sensitive assistance in a simple, easy to understand format.
Also included is a series of screen simulation videos where the user is taken step-by-step through the process of creating the various predictions, as well as the range of tables and charts produced by IOCAP.
These videos can be paused to allow the user to follow the narrator in creating their own predictions and analyzing the results
Ionospheric Characterisation Analysis and Prediction tool (IOCAP)
[/vc_column_text][vc_separator type=”normal” color=”#000000″][vc_row_inner row_type=”row” type=”full_width” text_align=”left” css_animation=””][vc_column_inner width=”1/2″][vc_column_text]Imagine relying on a “wall of numbers” to find the best rush-hour route from your home to work, instead of using a navigation app which uses live traffic reports to calculate the fastest route as you drive. What navigation apps have done for modern commuting amid constantly changing traffic, SANSA engineers have done for a type of communication technology that relies on signals that travel via the ionosphere and are sensitive to constantly changing space weather. This type of communication, called high-frequency (HF) radio, was common before satellite radio communication became the norm, particularly for long-distance communication. HF radio is of upmost importance in military and disaster relief communications, as shown recently during the Mozambique hurricane disaster, when cell phone communication systems became overloaded and satellite phones did not operate due to the heavy cloud cover.[/vc_column_text][/vc_column_inner][vc_column_inner width=”1/2″][vc_column_text][/vc_column_text][/vc_column_inner][/vc_row_inner][vc_column_text]In civil aviation many long-distance carriers keep contact with their base using HF radio. IOCAP can be used to calculate which frequency at any given point during the flight will provide the best communications. However, HF signal propagation (how these radio waves travel) is sensitive to changes in the ionosphere due to space weather. HF users require accurate forecasts of the conditions in the ionosphere that might affect the usable frequencies for their HF communications. IOCAP is a modern, user-friendly HF frequency prediction application produced by SANSA as a proudly South African product. IOCAP features a robust, proven prediction engine that provides dependable frequency predictions in the 3-30 MHz frequency band. Its primary aim is to make HF frequency predictions and their analyses accessible to HF operators of all experience levels. It is simple to use and contains innovative features not found in any other HF prediction software. [/vc_column_text][/qode_advanced_tab][qode_advanced_tab tab_title=”Overview”][vc_column_text]The Problem With HF Frequency Predictions
[/vc_column_text][vc_separator type=”normal” color=”#000000″][vc_column_text]The science of predicting HF frequencies is not new. In fact, it has been around in one form or another for almost 60 years. Modern computers brought this into the reach of any HF user with a PC. However, despite the indisputable usefulness in improving HF communications, available applications, have (for the most part) not enjoyed large scale acceptance by HF users. At the heart of this problem is the fact that available HF prediction software applications are complicated to use and the results are even harder to put to proper use. Users often end up settling for the list of predicted frequencies without even attempting to extract the more complex performance figures from the ‘wall of numbers’, as some call these results. The outcome is predictable: unreliable and not really worth the effort. SANSA has developed IOCAP in order to solve this challenge. Wrapped in a user-friendly, dynamic map based interface rests a class-leading, thoroughly proven prediction engine, making sure that the prediction results reflect today’s best understanding of the science of HF propagation. The results are neatly packed in colour-coded tables and intuitive charts, helping users put together a complete operational solution in just a few seconds.[/vc_column_text][/qode_advanced_tab][qode_advanced_tab tab_title=”How it Works”][vc_column_text]Leading the Way Through Innovation
[/vc_column_text][vc_separator type=”normal” color=”#000000″][vc_empty_space][vc_row_inner row_type=”row” type=”full_width” text_align=”left” css_animation=””][vc_column_inner][qode_accordion][qode_accordion_tab title=”Dynamic Maps Provide Context to Predictions”][vc_column_text]
IOCAP features two sets of world-wide maps, both of which are able to download new information from the internet as you zoom and scroll.
Maps can be annotated with communication stations and location markers, and distances measured by simply clicking two points.
Maps and their annotations can be printed and exported individually.
When an internet connection is detected, an online map service automatically becomes available for selection. This option features an alternate road map to the standard set, which includes the ability to select an annotated satellite, capable of zooming to street level.
- Point to Point Prediction. In this scheme it is assumed that both stations in the circuit have similar transmitters, receivers and antennas, so that the prediction from A to B is also valid for the return circuit from B to A.
- Reciprocal Prediction. In this instance the assumption is that the two station are asymmetric in design and characteristics, so two predictions are produced: one from A to B, using the transmitter at A and the receiver at B; and another from B to A, now using the transmitter at B and the receiver at A. This is not the same as simply reversing the direction of the circuit. The two predictions are then displayed side by side for easy comparison.
- Roaming Receiver Prediction. This solution assumes a stationary base station and a constantly moving receiver, such as a vehicle or ship. A point to point or reciprocal prediction is then created between the base station and each way point. The results are neatly packaged in a single, easy to understand report.
The three elements of a frequency prediction considered to be the most critical are:
- The variance between the predicted and matched frequency.
- The signal-to-noise ratio.
- The circuit reliability.
IOCAP does not require an internet connection to perform any of its functions. However, when such a connection is detected, a range of additional functions automatically becomes available.
For example, a real-time three-day forecast of geomagnetic activity (Kp index) is obtained from NOAA (USA) and displayed in an intuitive chart (shown). This allows IOCAP users to influence its frequency predictions with prevailing, real-time geomagnetic conditions.
The smoothed sunspot number (SSN) database is automatically synced with the latest data from the Royal Observatory of Belgium to ensure that predictions always use the most up-to-date SSN values.
IOCAP contains a comprehensive embedded Help system. All procedures and terms are explained in great detail. Most pages have a Help link which provides context-sensitive assistance in a simple, easy to understand format.
Also included is a series of screen simulation videos where the user is taken step-by-step through the process of creating the various predictions, as well as the range of tables and charts produced by IOCAP.
These videos can be paused to allow the user to follow the narrator in creating their own predictions and analyzing the results[/vc_column_text][/qode_accordion_tab][/qode_accordion][/vc_column_inner][/vc_row_inner][/qode_advanced_tab][qode_advanced_tab tab_title=”Testimonials”][vc_column_text]